PM broad
125.8
+2.5% vs a year ago (122.8)
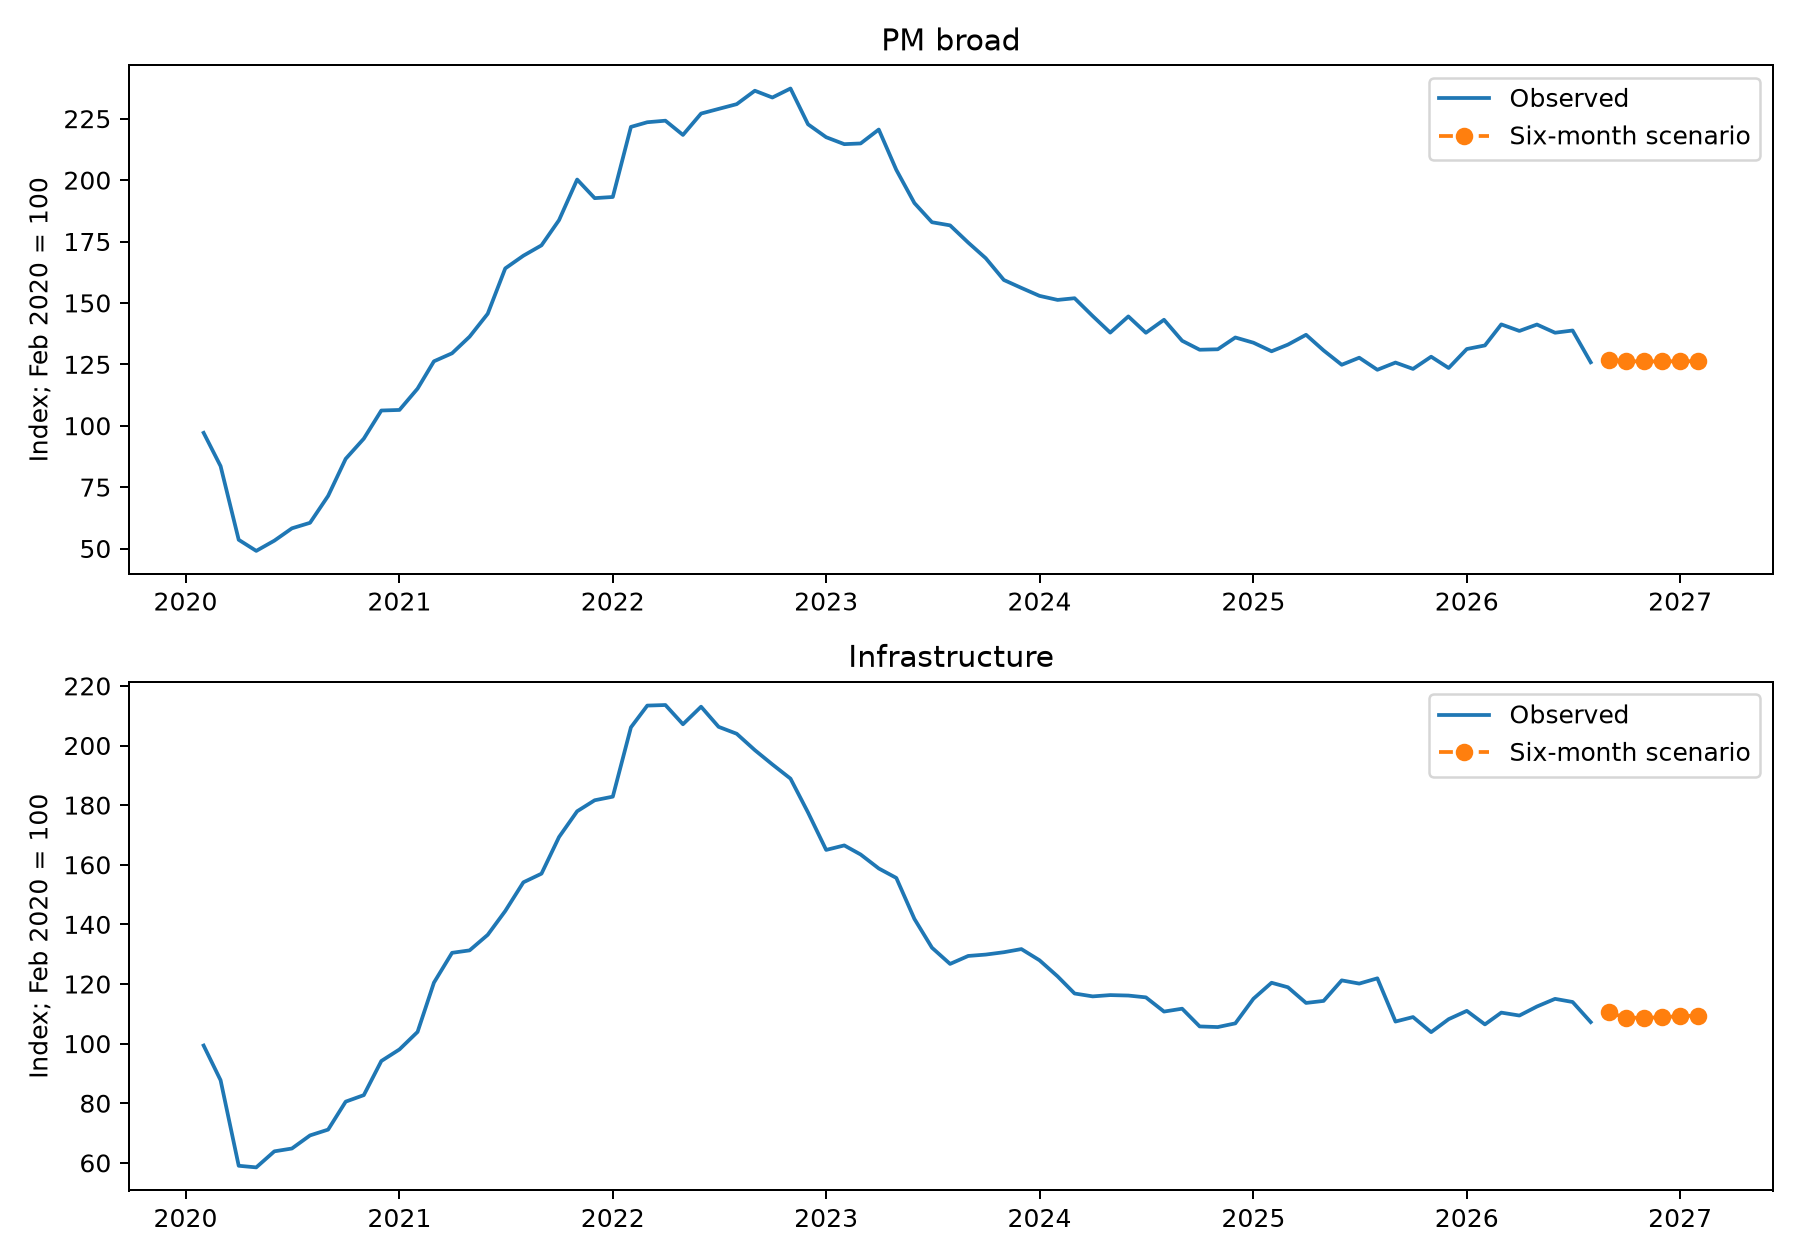
Six-month scenario: 126.3 by 2027-02
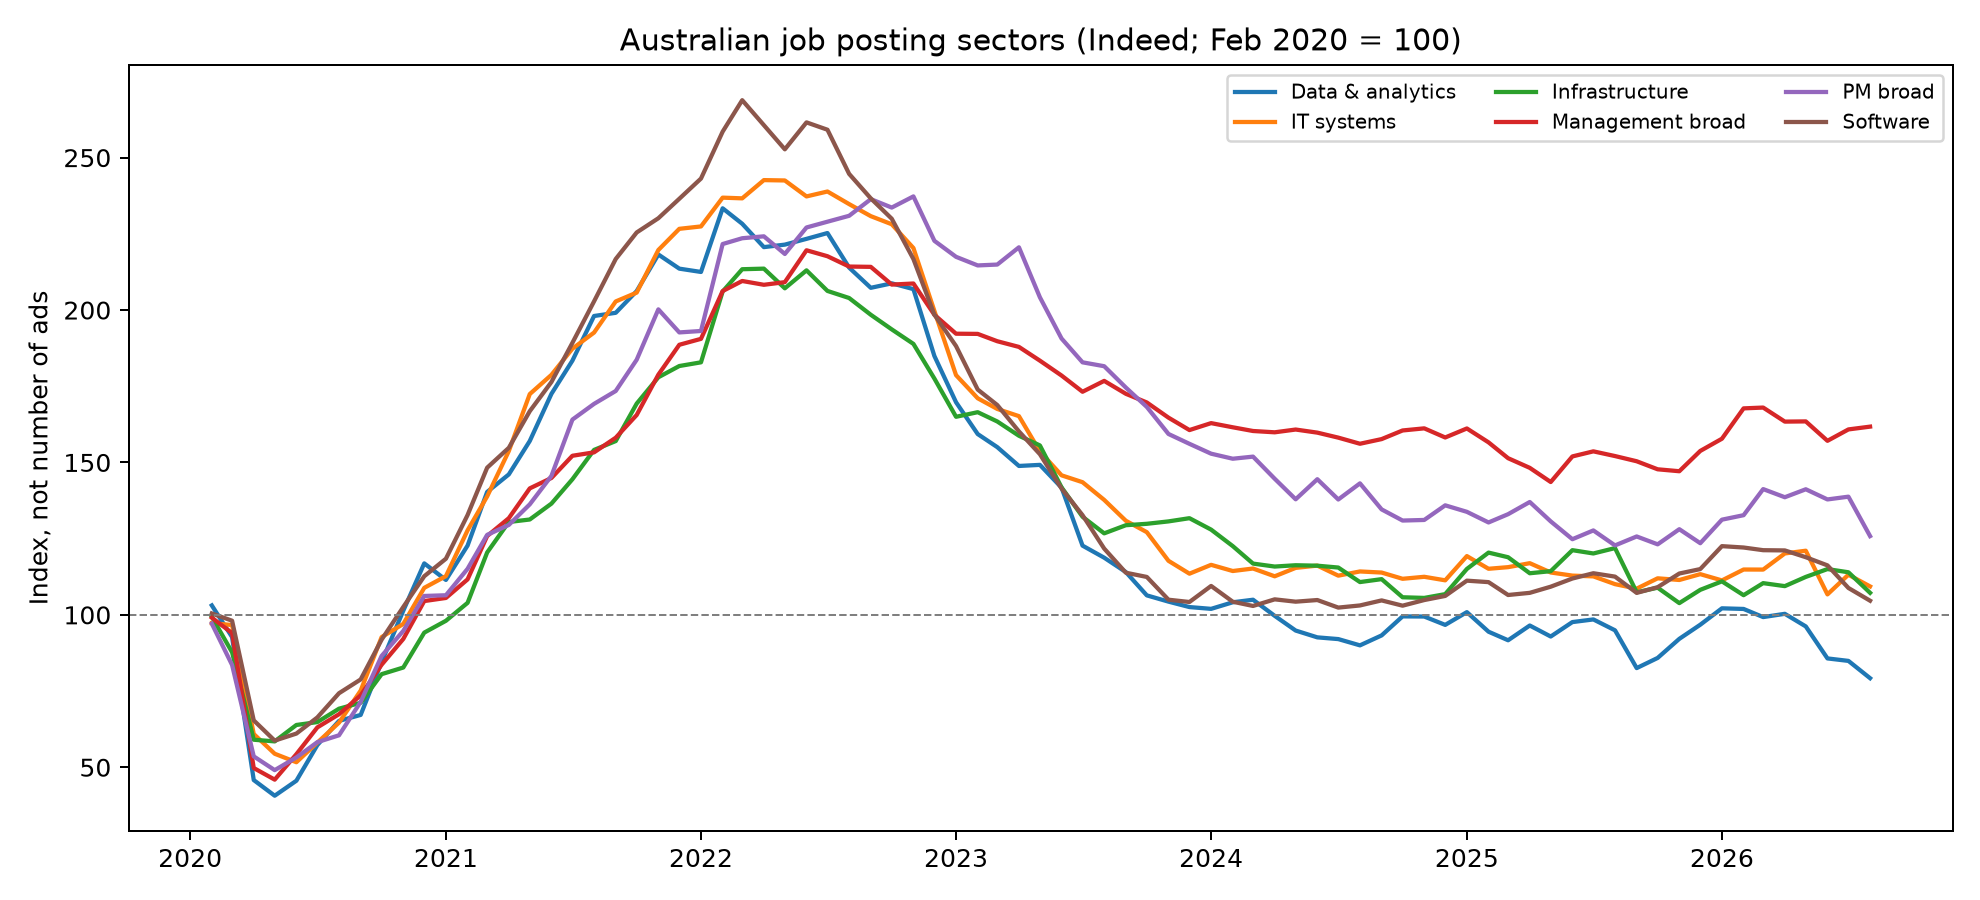
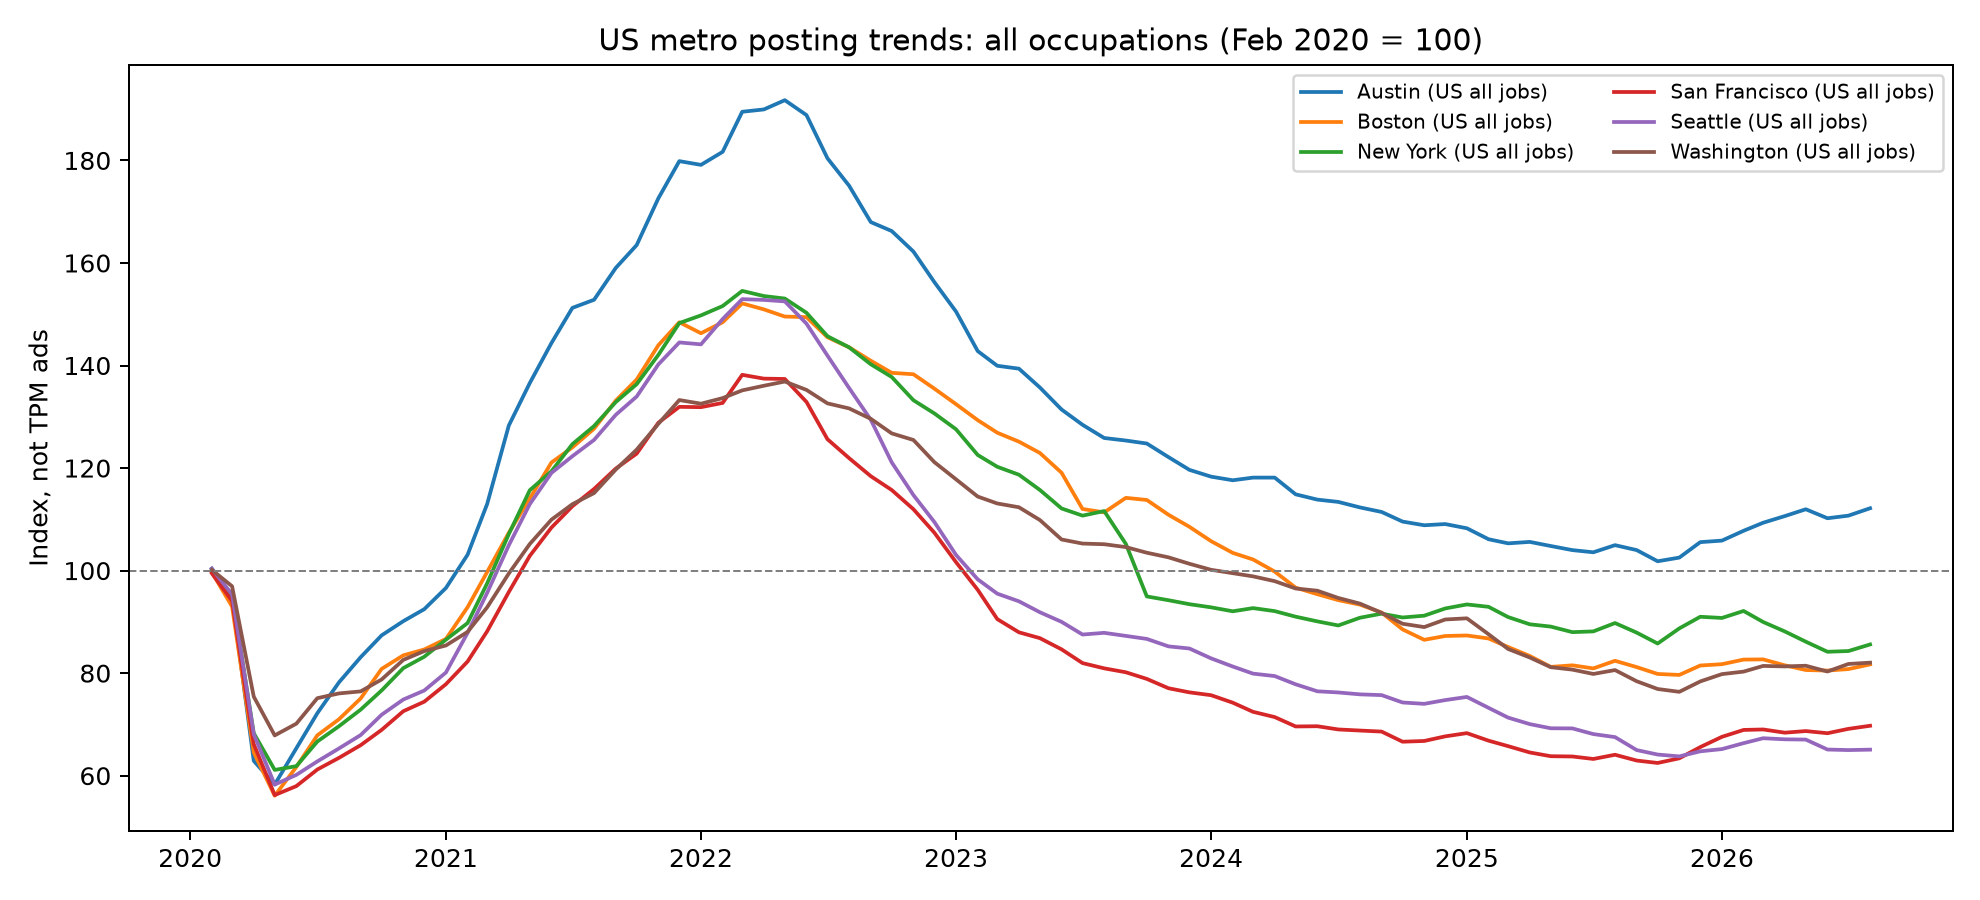
Indeed job-posting indexes (Feb 2020 = 100) for the Australian sectors that technical program managers draw from, plus overall hiring in six US tech metros, with six-month scenarios that are backtested against a simple baseline.
An index of 126 means 26% above its own February 2020 level, not 126 ads. Sectors are broad (e.g. "Project Management" includes non-technical roles), so these are not counts of TPM vacancies, and GPU/AI-infrastructure TPM cannot be measured from this data.
125.8
+2.5% vs a year ago (122.8)
Six-month scenario: 126.3 by 2027-02
107.2
-12.0% vs a year ago (121.9)
Six-month scenario: 109.3 by 2027-02 · model lost to baseline
109.3
-0.7% vs a year ago (110.1)
Six-month scenario: 115.3 by 2027-02 · model lost to baseline
79.2
-16.5% vs a year ago (94.9)
Six-month scenario: 94.5 by 2027-02
104.6
-7.0% vs a year ago (112.5)
Six-month scenario: 106.6 by 2027-02
161.8
+6.4% vs a year ago (152.1)
Six-month scenario: 160.8 by 2027-02
Recursive forecasts from the model chosen on validation data. Treat series whose model lost to the seasonal-naive baseline with extra scepticism.
| Series | 2026-09 | 2026-10 | 2026-11 | 2026-12 | 2027-01 | 2027-02 |
|---|---|---|---|---|---|---|
| Austin (US all jobs) | 111.3 | 110.5 | 110.5 | 110.4 | 110.2 | 109.9 |
| Boston (US all jobs) | 81.4 | 81.3 | 81.0 | 81.3 | 81.3 | 81.8 |
| Construction | 163.1 | 162.7 | 162.6 | 162.6 | 162.6 | 162.6 |
| Data & analytics | 89.4 | 92.1 | 94.1 | 94.6 | 95.5 | 94.5 |
| Electrical engineering | 147.5 | 148.7 | 150.0 | 153.0 | 155.1 | 157.1 |
| IT systems | 113.3 | 111.2 | 113.7 | 111.2 | 117.8 | 115.3 |
| Infrastructure | 110.5 | 108.7 | 108.7 | 108.8 | 109.3 | 109.3 |
| Management broad | 160.2 | 160.9 | 160.8 | 160.6 | 161.0 | 160.8 |
| New York (US all jobs) | 85.9 | 85.9 | 86.0 | 87.9 | 87.3 | 90.5 |
| PM broad | 126.9 | 126.3 | 126.2 | 126.2 | 126.3 | 126.3 |
| San Francisco (US all jobs) | 69.2 | 68.8 | 68.4 | 68.1 | 68.0 | 68.0 |
| Seattle (US all jobs) | 65.1 | 65.3 | 65.6 | 65.8 | 66.3 | 66.4 |
| Software | 108.3 | 108.9 | 106.7 | 106.9 | 106.7 | 106.6 |
| Washington (US all jobs) | 81.5 | 80.8 | 80.5 | 80.3 | 80.3 | 80.2 |
| Series | Index | Year ago | Change | Model | 6-month MAE | Seasonal naive MAE | Beats baseline? |
|---|---|---|---|---|---|---|---|
| Construction | 165.0 | 160.8 | +2.6% | forest_leaf6 | 8.66 | 11.79 | Yes |
| Data & analytics | 79.2 | 94.9 | -16.5% | forest_leaf3 | 6.04 | 8.04 | Yes |
| Electrical engineering | 145.3 | 140.7 | +3.3% | ridge_a1 | 5.28 | 7.48 | Yes |
| IT systems | 109.3 | 110.1 | -0.7% | forest_leaf3 | 3.34 | 2.94 | No |
| Infrastructure | 107.2 | 121.9 | -12.0% | forest_leaf6 | 8.83 | 5.86 | No |
| Management broad | 161.8 | 152.1 | +6.4% | forest_leaf6 | 5.53 | 10.55 | Yes |
| PM broad | 125.8 | 122.8 | +2.5% | forest_leaf6 | 4.87 | 7.05 | Yes |
| Software | 104.6 | 112.5 | -7.0% | forest_leaf6 | 7.91 | 8.67 | Yes |
Overall local hiring, not TPM roles.
| Series | Index | Year ago | Change | Model | 6-month MAE | Seasonal naive MAE | Beats baseline? |
|---|---|---|---|---|---|---|---|
| Austin (US all jobs) | 112.2 | 105.0 | +6.9% | forest_leaf3 | 3.34 | 5.49 | Yes |
| Boston (US all jobs) | 81.7 | 82.4 | -0.9% | forest_leaf3 | 1.98 | 4.03 | Yes |
| New York (US all jobs) | 85.6 | 89.8 | -4.7% | forest_leaf3 | 2.55 | 2.79 | Yes |
| San Francisco (US all jobs) | 69.7 | 64.1 | +8.8% | forest_leaf3 | 1.90 | 3.85 | Yes |
| Seattle (US all jobs) | 65.1 | 67.5 | -3.6% | forest_leaf3 | 2.83 | 6.42 | Yes |
| Washington (US all jobs) | 82.0 | 80.6 | +1.8% | forest_leaf3 | 3.67 | 6.50 | Yes |
Download: model_evaluation.csv · six_month_forecast.csv · holdout_predictions.csv · australia_monthly_index.csv · us_metro_monthly_index.csv